|
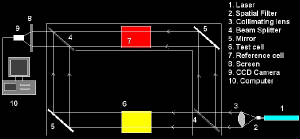
Figure at right shows the schematic diagram of a Mach-Zhender Interferometry. Laser
beam is collimated by lens system (3). The collimated beam is splitted into two beams with a beam splitter (4). One beam passes
via the test section (6) and the other via the reference section (7). Mirror (5) makes the test beam to interact with the
reference beam to produce interference patterns that can be seen at the screen (8). The image formed is captures using a CCD
camera (9) and data is transferred to computer (10) for further image processing.
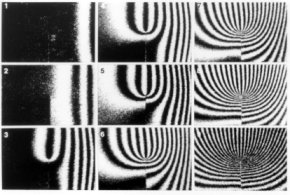
As we have already seen that the interferometry image is formed due to constructive/destructive interference between
test and the reference beam. This happens due to difference in path lengths between the two beams. So it is very important
to have similar fluid zone at the reference section, as the test section, to maintain same path length initially.
A big amount of effort is involved in finding the initial setting, which is a tedious job of playing with the optics
to maintain simiar path length between test/reference beam. Once that's done we would see a clear image (see right). Any disturbance
caused henceforth would cause the test beam to pass via higher path length and this difference in path length would cause
the fringe patterns.
We can operate with two kinds of initial setting's. Infinite-fringe setting and wedge-fringe setting. The figure shown
above is for the case of infinite-fringe case. For wedge setting, some initial path differences are maintained to get initial
fringes in the screen. Both of them provides different information in the final image. Infinite setting gives the isotherms
and wedge setting gives the temperature profiles. Images below show the wedge (left) and infinite (right) fringe results for
an candle flame.
Interferometry is a very standard method for quantitative temperature measurement. More details of image post processing
for quantitative information can be found in literatures and will not be discussed in details here. It can also be used to
abstract 3-d information using tomographic technique involving multiple view's.
|